Union Pacific 2016 Building America Report

Union Pacific

2016 Building America
Report

A report to communities on our social, environmental and economic sustainability progress.

Occupational Health Nurse Trudy Forbes
Track Supervisor Demarcus Thompson
Electrician Stoe Saing
Carman Refugio Rickford

Union Pacific's mission of service defines us and drives our commitment to safely transport products across the country, provide good jobs, operate ethically and invest in our communities.

This report details our progress in key areas supporting social, economic and environmental sustainability pillars: operating safely, strengthening communities, engaging employees and working to preserve the environment. We also summarize our 2016 financial performance.

We used the Global Reporting Initiative's global sustainability reporting standards as a guide to report our most material social responsibility issues. This publication focuses on initiatives and accomplishments from the 2016 calendar year and includes 2016 data, unless otherwise noted.

Download the Report

Our Vision

Building America

Our Mission

The Men and Women of Union Pacific are Dedicated to Serve

Our Values

Passion for Performance
High Ethical Standards
Work as a Team

Letter to Stakeholders

Sustainability is fundamental to Union Pacific's vision of Building America. Our rail network crosses 23 states, connecting communities to opportunity – and our country to sustainable economic growth. It is our duty to deliver products in a safe, reliable, fuel-efficient and environmentally responsible manner.

Union Pacific is committed to operating responsibly and serving customers with excellence, which our 43,000 employees accomplish with ingenuity and integrity. Community and infrastructure investments also play an important role in Union Pacific's mission to serve. Each section of this Building America Report describes key initiatives and reflects on our performance over the last year.

  • Economic Impact illustrates how Union Pacific drives economic growth in the 23 states where we operate through direct employment, capital investments and in-state sourcing efforts.
  • Operating Safely details our relentless investments and innovations to maintain a safe rail network. This section also showcases our ongoing efforts to increase public safety near railroad tracks.
  • Strengthening Communities demonstrates the role Union Pacific plays in our 7,000 communities. This includes investments in developing workforces, employees' donations and volunteer efforts, and partnerships with colleges and universities.
  • Engaging Employees outlines our commitment to our employees by creating fulfilling careers, including well-being, training and development investments.
  • Preserving the Environment highlights efforts to increase fuel efficiency, reduce carbon emissions and partnerships with communities and government agencies to preserve ecosystems across our network.

Our sustainability approach is evolving. One of the most exciting developments is the Union Pacific Foundation's renewed focus on partnerships centered on safety, workforce development and enhancing community spaces. This will enable us to multiply the positive impact we have in the communities we serve. Details of the Foundation's evolving role are outlined in the Strengthening Communities section.

We are proud of the work we do and understand there always is more to learn. This report is part of our ongoing conversation with you, our stakeholders, and we truly value your feedback.

Lance Fritz
Chairman, President and CEO

Building America Report 2016 - Lance Fritz - Chairman, President and CEO

Our Company

Union Pacific Railroad is the principal operating company of Union Pacific Corporation (NYSE: UNP). We are one of America's most recognized companies, with a heritage of building the country and a vision to keep doing so.

Our rail network connects 23 states in the western two-thirds of the country, providing a critical link in the global supply chain. Over the last 10 years, from 2007 to 2016, Union Pacific invested approximately $34 billion in our network and operations, supporting America's transportation infrastructure and enabling economic growth.

Fast Facts

43,000Employees

32,100Route Miles

8,500Locomotives

23States

7,300Communities served

Building America Report 2015 - Main - About UP Fast Facts map

Financial Performance

Union Pacific adds value to the U.S. economy through our operations' profits and shareholder returns. In 2016, we reported net income of $4.2 billion or $5.07 per diluted share. This represents 11 and 8 percent decreases, respectively, compared to the $4.8 billion or $5.49 per diluted share we reported in 2015. We had operating revenues of $19.9 billion compared to $21.8 billion in 2015, a 9 percent decrease, and operating income of $7.3 billion compared to $8.1 billion, a 10 percent decrease.

Market factors such as soft energy prices, the impact of the strong U.S. dollar on exports and a sluggish domestic consumer economy were the major drivers of a 7 percent decline in total volume last year. Carloadings were down in four of our six commodity groups, including a 20 percent decrease in coal traffic alone. On the positive side, a large U.S. grain harvest, along with strong global demand, drove a significant increase in our grain shipments, especially in the latter part of the year.

2016 Freight Revenue

Building America Report 2015 - Main - Diversified Business Product Pie Chart

What We Carry

Union Pacific moves the goods American families and businesses use every day. Our diversified business mix includes food we eat, cars we drive, chemicals to clean water and steel to build cities.

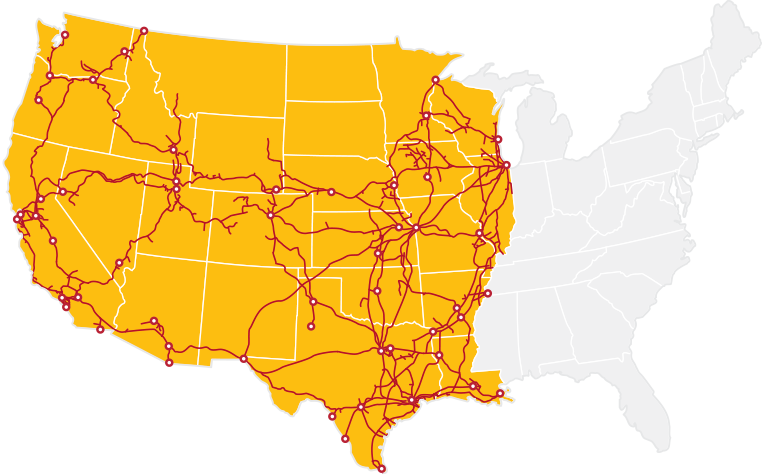
Our railroad serves many of the fastest growing cities in the United States and connects all major West Coast and Gulf Coast ports to Canada, Mexico and the country's eastern gateways. We have roughly 10,000 direct customers, and work to deliver products in a safe, reliable, fuel-efficient and environmentally responsible manner.

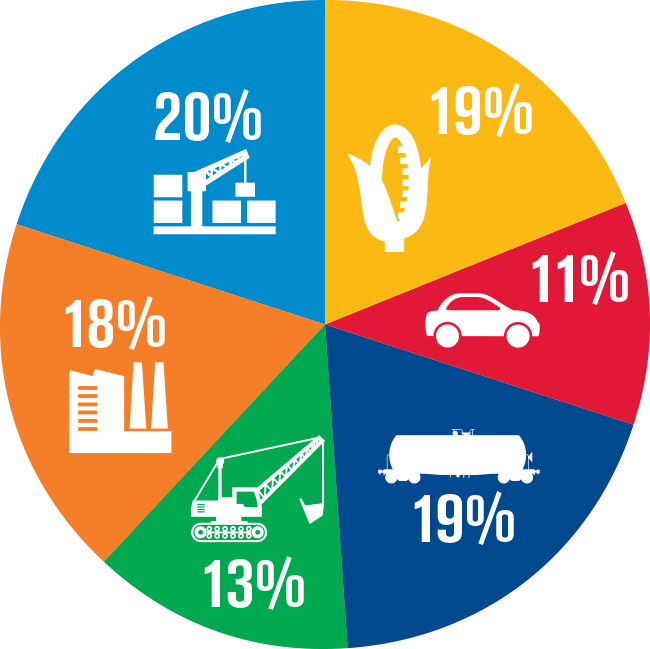
Diversified Business Products

Agricultural Products

The whole grains and other agricultural goods we haul feed America and many other parts of the world.

Automotive

We transport automotive parts, finished vehicles and aftermarket vehicles, taking them from assembly plants, operating or accessing distribution centers for all major auto manufacturers, and distributing imported vehicles from the West Coast and Gulf of Mexico.

Chemicals

Chemicals we carry help clean drinking water, produce plastics and fertilize crops. We also transport petrochemicals, crude oil and soda ash.

Coal

Coal generated about 30 percent of America's electricity in 2016, according to the U.S. Energy Information Administration. We ship coal from mines in the Southern Powder River Basin, Utah, Colorado, southern Wyoming and southern Illinois, delivering to electric plants as well as ports.

Industrial Products

We carry a broad range of raw materials and finished goods, including steel, pipe, frac sand, cement, military equipment, wind turbine components and lumber.

Intermodal

We transport intermodal freight containers for domestic and international shippers, moving products such as electronics, toys, furniture and clothing. One Union Pacific intermodal train takes up to 300 trucks off America's congested highways.

Mexico Markets

We are the leading freight transportation services provider between the United States and Mexico, and the only railroad to serve all six major Mexico gateways.

View More

Risk Oversight of the Company

We operate a dynamic enterprise risk management process, with continuous monitoring to identify and address potential risks. This includes risks arising in the ever-changing economic, political and legal environments in which Union Pacific operates.

Management identifies and prioritizes enterprise risks and regularly presents them to our board of directors for review and consideration. Our chief compliance officer reports to the board on risk mitigation strategies, supported by senior executives responsible for implementing risk mitigation. We also report risk factors in our Annual Report Form 10-K.

Our board's audit committee oversees the company's enterprise risk internal audit. Internal auditors present their findings on mitigating controls and processes to the committee, which in turn reports to the board.

Sustainability Management Approach

Our business grows by understanding the needs of our communities and customers – and responding to those needs with dedication and commitment. Our sustainability approach reflects this. We are committed to engaging employees in our mission, transporting products safely, providing good jobs, operating ethically and investing in America's communities.

Our Sustainability and Citizenship Goals

Union Pacific's Building America report details the company's progress against the key pillars of our sustainability and citizenship strategy:

  • Operating a safe, efficient and environmentally responsible rail network that delivers the best customer experience.
  • Providing employees with the safest work environment.
  • Constantly improving employee, customer and public safety through training, education, innovation and investment.
  • Developing programs and processes making us an employer of choice.
  • Investing in our network infrastructure to enhance safety, service and efficiency.
  • Growing our business profitably and responsibly so we can invest in the future and make positive impacts on employees, communities, customers and shareholders.
  • Creating economic strength and improving quality of life in the 7,000 communities where we operate.

We track our performance toward these goals using the Key Performance Indicators (KPIs).

Building America Report 2015 - Main - Stakeholder Outreach

Greg Wilson, Inspection Vehicle Operator

Key Performance Indicators

  • FINANCIAL 2014 2015 2016
    Reported net income $5.2 billion $4.8 billion $4.2 billion
    Operating revenue $24.0 billion $21.8 billion $19.9 billion
    OPERATING SAFELY 2014 2015 2016
    Rail crossing accidents (per million train miles) 2.34 2.28 2.43
    Reportable injury rate
    (per 200,000 employee-hours)
    0.98 0.87 0.75
    Public outreach About 13,580 events, reached more than 629,500 people More than 15,000 events reached more than 600,000 people More than 14,500events reached more than 498,000 people
  • STRENGTHENING COMMUNITIES 2014 2015 2016
    Capital program
    (private funds, no taxpayer dollars)
    $4.1 billion $4.3 billion $3.5 billion
    Spend with minority- and women-owned businesses $509 million $423 million $325 million
  • ENGAGING EMPLOYEES 2014 2015 2016
    Percent of employees unionized 85% 85% 85%
    Workforce diversity 6% Female, 94% Male
    2% Asian
    11% Black
    73% Caucasian
    12% Hispanic
    2% Native American
    6% Female, 94% Male
    2% Asian
    11% Black
    73% Caucasian
    12% Hispanic
    2% Native American
    6% Female, 94% Male
    2% Asian
    11% Black
    72% Caucasian
    13% Hispanic
    2% Native American
    U.S. Population 2015 census data (permits reporting of more than one race): 5% Asian, 13% Black, 77% Caucasian, 17% Hispanic, 1% Native American
  • PRESERVING THE ENVIRONMENT 2014 2015 2016
    Energy usage 48.4 million megawatt hours 44.5 million megawatt hours 40.6 million megawatt hours
    Water usage withdrawals 1.78 billion gallons 1.54 billion gallons 1.25 billion gallons
    GHG emissions
    Intensity per million gross ton miles 12.6 metric tons 12.7 metric tons 12.6 metric tons
    Locomotive fossil fuel emissions (scope 1) 11,850,514 metric tons 10,834,984 metric tons 9,913,870 metric tons
    Fossil fuel emissions (scopes 1 and 2) 12,666,733 metric tons 11,683,549 metric tons 10,685,250 metric tons
    Employee travel (scope 3) 19,977 metric tons 19,803 metric tons 18,603 metric tons
    Purchases from biomass sources 87,744 metric tons 129,600 metric tons 119,872 metric tons
  • PRESERVING THE ENVIRONMENT 2014 2015 2016
    Waste
    Total waste generated 1.05 million tons 1.04 million tons 1.15 million tons
    Tonnage diverted from landfills 81% 68% 67%
    E-waste Approximately 270,000 pounds recycled or reused Approximately 270,000 pounds recycled or reused Approximately 270,000 pounds recycled or reused

Business and Industry Affiliations

Union Pacific is a member of many national industry and business organizations including those listed below.

  • American Frozen Foods Institute.
  • American Wind Energy Association.
  • Association of American Railroads.
  • Food Shippers of America.
  • GoRail.
  • GreenBiz Executive Network.
  • National Association of Manufacturers.
  • National Business Group on Health.
  • National Freight Transportation Association.
  • National Grain and Feed Association.
  • National Minority Supplier Development Council.
  • National Safety Council.
  • Operation Lifesaver.
  • United States-Mexico Chamber of Commerce.
  • U.S. Chamber of Commerce.
  • Women's Business Enterprise National Council.

Stakeholder Engagement

Everything Union Pacific does is built on our vision, mission and values. Our strategy drives value to Union Pacific's key stakeholders – shareholders, communities, employees and customers. Union Pacific's approach to sustainability requires engaging with our four key stakeholder groups to understand their evolving needs.

Key Audiences

Employees

Union Pacific employees work 24/7 in more than 7,000 communities across our service area. We engage employees through:

  • Communication from our CEO in many forms including online and in-person town halls with question-and-answer sessions. CEO system wide videos cover key issues such as safety and employee engagement, and a CEO blog highlights observations in the field and topics affecting the company.
  • Information Television network.
  • Senior management town halls with question-and-answer sessions.
  • Employee clubs, resource groups, networks, focus groups and surveys.
  • Labor Relations Connection, an online portal for union employees.
  • Ethics bulletins and our values line, allowing employees to report concerns anonymously.

Customers

Communication is at the heart of our customer relationships, enabling us to develop solutions meeting their changing needs and supporting their growth. We engage with customers through:

  • Social media.
  • Customer bulletins.
  • Regular meetings and customer web portals.
  • Customer satisfaction surveys, evaluations and suggestions.
  • Our National Customer Service Center.

Communities

Union Pacific's business has a positive impact on local communities through economic development, good paying jobs and reduced congestion on roads. We seek to support communities and manage potential negative impacts through:

  • Local public affairs representatives, who work with elected officials, economic development alliances, civic groups and other community organizations.
  • Our national 24/7 emergency hotline. In addition to emergency response, operators work with callers reporting issues such as blocked crossings.
  • Event sponsorships and employee volunteering.
  • The Union Pacific Foundation.
  • Our Crossing Accident Reduction and Education Safety program, UP CARES.
  • Free safety training for emergency responders.
  • Inside Track, our self-publishing website for communities.
  • Social media platforms including Facebook, LinkedIn, Twitter, Instagram and YouTube.

Shareholders

Clear communication with shareholders is important to Union Pacific. We engage them through:

  • Annual reports, proxy statements and SEC filings.
  • Our Investor Relations site featuring upcoming events, public filings, industry reports, shareholder resources and answers to frequently asked questions.
  • Annual Building America Report and Fact Book.
  • Shareholder meetings with management and investor conferences.
  • Quarterly earnings, reports and conference calls.

Regulatory Officials

Union Pacific works closely with regulatory officials to align our business with the country's infrastructure requirements and shape a responsible and sustainable operating environment:

  • Transparent compliance reports, voluntary agreements and in-person meetings.
  • Ongoing dialogue via staff in Washington, D.C., and across our network.
  • Participation in the Association of American Railroads and U.S. Environmental Protection Agency's SmartWay Transport Partnership.
  • Employee and corporate regulatory and legislative advocacy.
  • The Union Pacific Environmental Management Program.
  • Agreements with the California Air Resources Board and other states.
  • Collaboration with U.S. Customs and Border Protection and other government agencies.

Suppliers

Suppliers are an important part of Union Pacific's business – they help us serve our customers with excellence and provide quality materials. We manage suppliers through our supplier code of conduct and quality program, engaging them through:

  • Electronic commerce capabilities.
  • Supplier performance tracking system.
  • Supplier diversity program.
Building America Report 2016 - Main - Stakeholder Outreach

Union Pacific employees live and work in many of the communities we serve. We are dedicated to operating safely for the good of our customers and the places we call home.

Building America Report 2016 - Main - Stakeholder Outreach

Union Pacific Safety Manager Kevin Barnett and League City, Texas, Mayor Pat Hallisey at a community event in the Houston area.

Key Awards and Recognition

Union Pacific is proud of the external recognition for efforts to operate safely, strengthen communities, engage employees and preserve the environment. We were recognized with the following awards in 2016.

  • No. 1 in Fortune's Most Admired among trucking, transportation and logistics companies for the sixth consecutive year.
  • Named in Forbes' 100 Most Trustworthy Companies and Best Employers' lists.
  • Recognized as America's Top Military-Friendly Employer by G.I. Jobs.
  • Named Best for Vets Employer by Military Times.
  • Named to the Most Valuable Employer in Military list by civilianjobs.com.
  • Recognized as a Globally Certified Healthy Workplace by the Global Centre for Healthy Workplaces.
  • Named a Top Green Provider by Food Logistics.
  • Moved up 40 spots on Newsweek's Green Rankings for the world's largest companies on corporate sustainability and environmental impact.
  • Recognized as top performer in the Soy Transportation Coalition Railroad Report Card.
  • Named to CDP's Climate Leadership Index.
Building America Report 2016 - Main - Key Awards and Recognition

Union Pacific machinist Alia Eden works on locomotives at a shop in Salt Lake City, Utah.

Looking Ahead

FEEDBACK

For questions on this report or to provide feedback, contact Union Pacific via email at sustainability@up.com.

OUR COMMITMENT

Since our founding more than 150 years ago, Union Pacific has driven economic growth in America. Our mission, strategy and workforce all are focused on completing tasks better tomorrow than we do today, enabling Union Pacific to remain critical to the American economy in the centuries to come. We will continue to strive to be the best in the business in our safety initiatives, on our tracks, in our communities, across our workforce and for our environment. The 2016 Union Pacific Building America Report shares our initiatives and progress thus far. We are proud of our accomplishments and our work to improve our operations. In the years ahead, we will continue to invest in our employees, communities and infrastructure because they shape our growth and success.

ADDITIONAL RESOURCES

For ongoing updates on our citizenship and sustainability efforts, visit the following.

  • Media. Up-to-date information about Union Pacific
  • Environment. Sustainability commitments and progress
  • Employees. Programs and services available to the members of our workforce
  • Customers. Product offerings and business groups
  • Investors. Annual report, proxy statements and other SEC filings
  • Communities. News, photos and video about Union Pacific, our employees and the communities where we operate

CAUTIONARY INFORMATION

Our 2016 Building America Report provides additional explanatory information regarding Union Pacific that may not be available, included or directly derived from information in the company's Annual Report. This report includes statements and information regarding future expectations or results of the company that are not historical facts. These statements and information are, or will be, forward looking as defined by the federal securities laws. Forward-looking statements and information can be identified by use of forward-looking terminology (and derivations thereof), such as "believes," "expects," "may," "should," "will," "would," "intends," "plans," "estimates," "anticipates," "projects" and other words or phrases of similar intent. Forward-looking statements and information generally include the following: the company's expectations or forecasts with respect to general economic conditions in the United States and the world; the company's financial and operational performance; increases of the company's earnings; demand for the company's rail service; improving customer service; enhancing profitability; volume and revenue growth; efficiency improvements and increasing returns; and improving asset utilization. Statements also include the effectiveness or growth of new and newer services; management of network volumes; increasing shareholder value; total amount of capital investments; completion and effectiveness of capacity expansion and other capital investments, and other investments in infrastructure improvements; returns on capital investments; improvements regarding safety of our operations and equipment; improving efficiencies in fuel consumption; preserving the environment and communities where the company operates; and effectiveness of plans, programs and initiatives to reduce costs and other efficiency improvements. Forward-looking statements and information should not be read as a guarantee of future performance or results and will not necessarily be accurate indications of the times that, or by which, such performance or results will be achieved. Forward-looking statements and information are subject to risks and uncertainties that could cause actual performance or results to differ materially from those expressed in the statements. Forward-looking statements and information reflect the good faith consideration by management of currently available information and may be based on underlying assumptions believed to be reasonable under the circumstances. However, such information and assumptions (and, therefore, such forward-looking statements and information) are or may be subject to variables or unknown or unforeseeable events or circumstances over which management has little or no influence or control.

The risk factors in Item 1A of the company's Annual Report on Form 10-K, filed Feb. 3, 2017, could affect our future results and could cause those results or other outcomes to differ materially from those expressed or implied in the forward-looking statements and information. This report should be read in consideration of these risk factors. To the extent circumstances require or the company deems it otherwise necessary, the company will update or amend these risk factors in subsequent Annual Reports, periodic reports on Form 10-Q or current reports on Form 8-K. Forward-looking statements speak only as of the date the statement was made. We assume no obligation to update forward-looking information to reflect actual results, changes in assumptions or changes in other factors affecting forward-looking information. If we do update one or more forward-looking statements, no inference should be drawn that we will make additional updates with respect thereto or with respect to other forward-looking statements.