Building America Report


2017 Building America Report
A report to communities on our social, environmental and economic sustainability progress.
About the Report
Union Pacific's mission of service defines us and drives our commitment to safely transport products across the country, provide good jobs, operate ethically and invest in our communities.
This report details our progress in key areas supporting social, economic and environmental sustainability pillars: operating safely, strengthening communities, engaging employees and preserving the environment. We also summarize our 2017 financial performance.
We used the Global Reporting Initiative's global sustainability reporting standards as a guide to report our most material social responsibility issues. This publication focuses on initiatives and accomplishments from the 2017 calendar year and includes 2017 data, unless otherwise noted.
Letter to Stakeholders
Trust was a major theme in 2017 – trust in news, government and business. At Union Pacific, our reputation for having a passion for performance, high ethical values and dedication to teamwork is a source of pride.
This report is part of the ongoing conversation with you, our stakeholders, who trust us to operate responsibly and transparently as we fulfill our promise to build America. It details the many ways we make a difference in the communities where we live and work – delivering goods Americans use every day; helping our customers be more efficient and sustainable; creating family-supporting jobs; building vibrant, safe communities; and attaining our overall goal to operate in an incident-free environment.
Each section of this Building America Report describes key initiatives and reflects on 2017's performance. We identified these materiality pillars by listening to our stakeholders and understanding what's important, and why.
- Economic Impact illustrates how Union Pacific drives economic growth in the 23 states where we operate through employment, capital investments and in-state sourcing efforts.
- Operating Safely details our relentless efforts to maintain a safe railroad for our employees and the communities we traverse. It is equally important to educate our neighbors about safety near railroad tracks.
- Strengthening Communities demonstrates our commitment to act for a greater good, giving back our time, money and expertise. Through these efforts, we can better connect with each other and make a positive difference for future generations.
- Engaging Employees outlines our promise to create fulfilling careers with advancement opportunities, as well as promote healthy lifestyles.
- Preserving the Environment highlights efforts to increase fuel efficiency, reduce carbon emissions, and build partnerships with communities and government agencies protecting ecosystems across our network.
Our success is deeply rooted in innovation and a mindset of never being satisfied with current results. We challenge ourselves to look for new ways of doing things, in our daily tasks and on a global scale. For example, I'm proud of our team for creating SensorX – a smart sensor that measures vibration and rail movement, collecting 40,000 measurements a second. Originally designed to feed the precision needs of Machine Vision – an erector-set-like portal outfitted with high-speed cameras and lasers to measure 22 different components of passing rail cars for potential defects – the technology quickly turned into a stand-alone product. We continue evolving it, learning from results.
In 2017, our Premium Operations team rolled out UP GO, a new mobile app similar to pre-check for airlines. It allows dray drivers frequently visiting our intermodal ramp in Lathrop, California, to verify information, reducing delays. We have not yet reached the app's full potential, and I'm excited to see how we can use this tool to enhance safety and security, lower congestion and shorten lines – another step toward reducing emissions.
Union Pacific's sustainability efforts were recognized globally by CDP, receiving an A- and leadership status on the agency's 2017 climate change survey. We are proud of this accomplishment and committed to finding new ways to further reduce climate change risk.
Our dedication has never been stronger to driving a healthy environment, positively impacting society and supporting a growing global economy.

Lance Fritz
Chairman, President and CEO
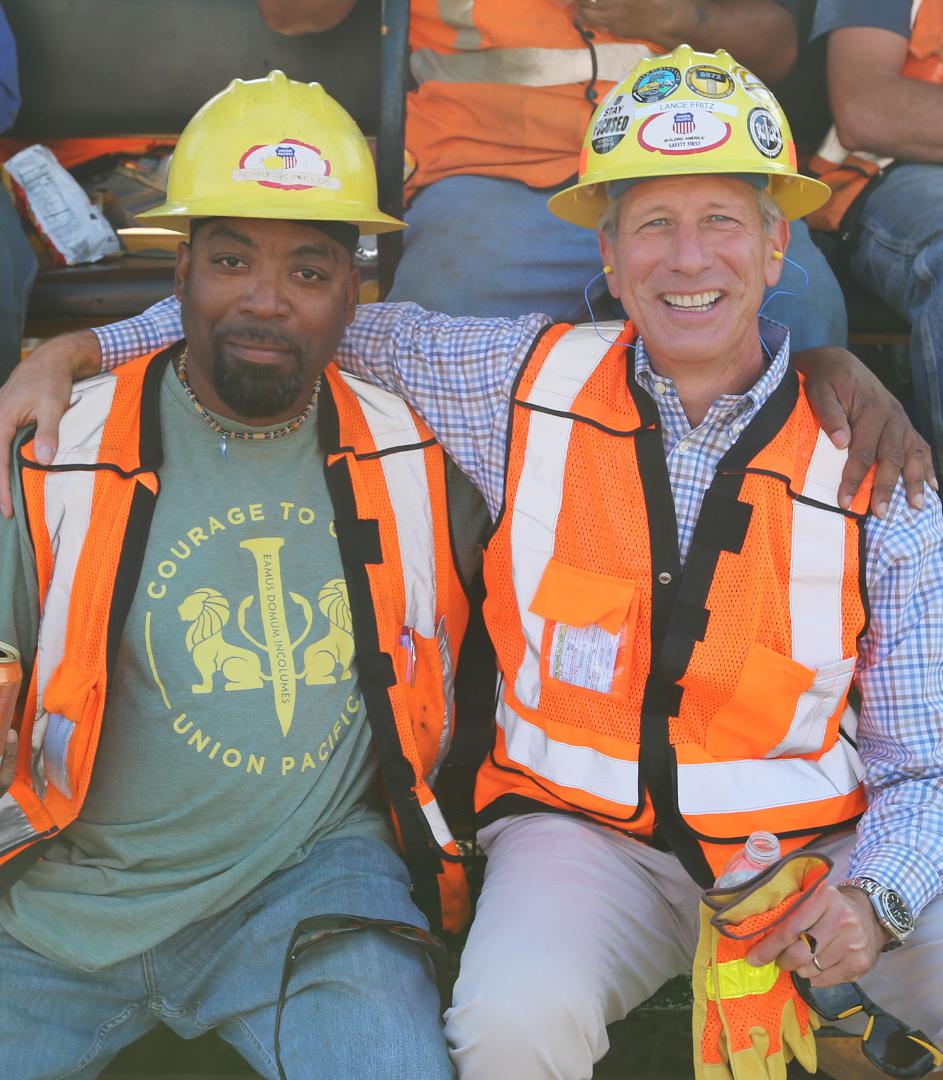
Chairman Lance Fritz visits with Gang 9075 System Laborer Chuck Fields at a leadership feld visit in Clinton, Iowa.
Our Company
Union Pacific Railroad is the principal operating company of Union Pacific Corporation (NYSE: UNP). We are one of America's most recognized companies, with a heritage of building the country and a vision to keep doing so.
Our rail network connects 23 states in the western two thirds of the country, providing a critical link in the global supply chain. Over the last 10 years, from 2008 to 2017, Union Pacific invested $34 billion in our network and operations, supporting America's transportation infrastructure and enabling economic growth.
Vision
Building America
Our vision symbolizes the Union Pacific experience for all the people whose lives we touch. It connects the importance of UP's rail transportation to America's economy, honors the generations that preceded us and is the promise for the generations that will follow.
Mission
Dedicated to Serve
Union Pacific works for the good of our customers, shareholders, communities and one another. Our commitment defines us and drives the economic strength of our company and our country.
Values
Performance
Our passion, concentration and determination will drive our safety, customer satisfaction and quality results.
High Ethics
Our reputation will always be a source of pride for our employees and a bond with our customers, shareholders and communities.
Teamwork
We are all part of the same team, and working together to reach our common goals is one of our strengths. Communication and respect are the foundation of great teamwork.
Financial Performance
Freight railroads are the backbone of the U.S. economy, supporting the livelihoods of employees in nearly every sector. Union Pacific's diversified portfolio generates its operations' profits and shareholder returns, further stimulating the economy.
In 2017, we reported net income of $10.7 billion or $13.36 per diluted share, compared to $4.2 billion or $5.07 per diluted share in 2016. After adjusting for the impact of corporate tax reform which was passed prior to year-end, net income was $4.6 billion or $5.79 per diluted share*, 10 and 14 percent increases, respectively, compared to 2016. Our operating revenue was $21.2 billion compared to $19.9 billion in 2016, a 7 percent increase, and our adjusted operating income was $7.8 billion* compared to $7.3 billion, an 8 percent increase.
Overall carloadings were up 2 percent in 2017 led by Industrial Products and Coal business unit increases of 12 percent and 6 percent, respectively, driven primarily by a robust increase in frac sand shipments. Automotive shipments were down 3 percent, resulting from lower domestic sales and reduced vehicle production, while Chemical and Agricultural Product shipments were both down 2 percent, as we experienced declines in our crude oil volumes and grain carloadings. Intermodal volumes were flat compared to 2016.
* Non-GAAP results, adjusted to exclude Corporate Tax Reform impact. See Union Pacific's website, under Investors, and select Annual Report 10-Ks to read the Feb. 9 filing for a GAAP reconciliation.
What We Carry
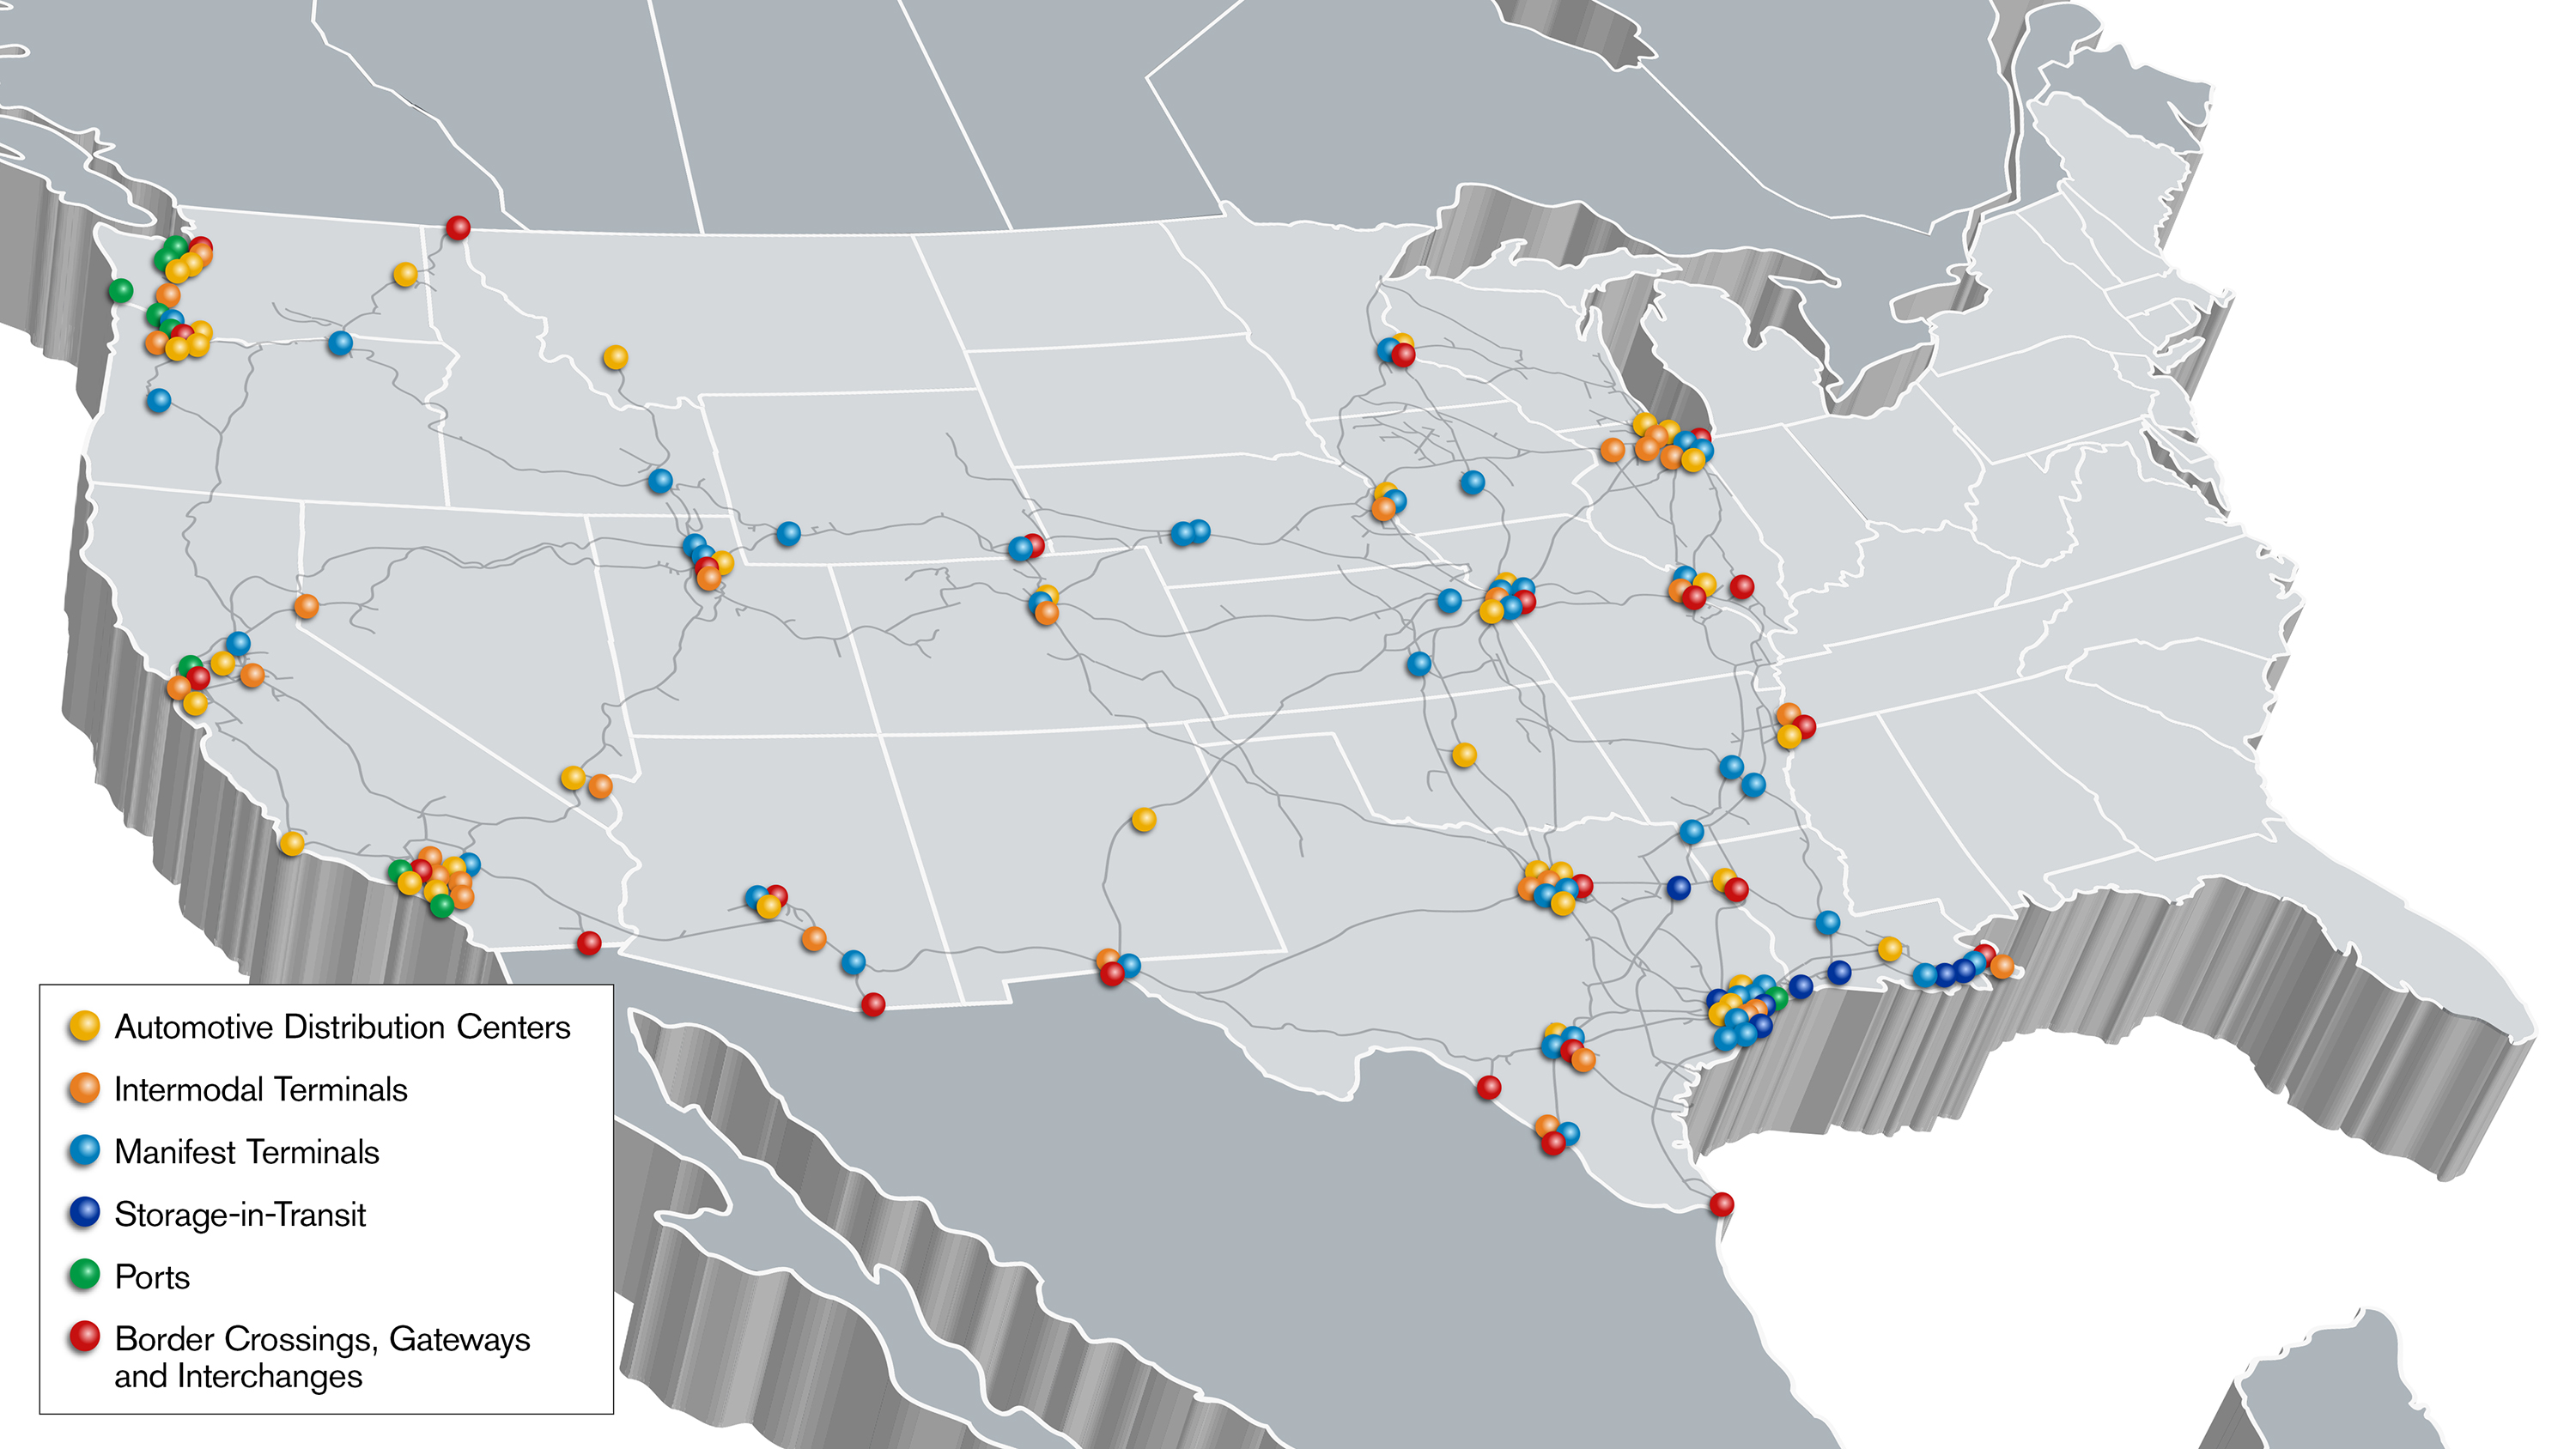
Union Pacific moves the goods American families and businesses use every day, including the food we eat, the cars we drive, the chemicals to clean our water and the steel to build our communities. We have roughly 10,000 customers and work to deliver their products in a safe, reliable, fuel-efficient and environmentally responsible manner.
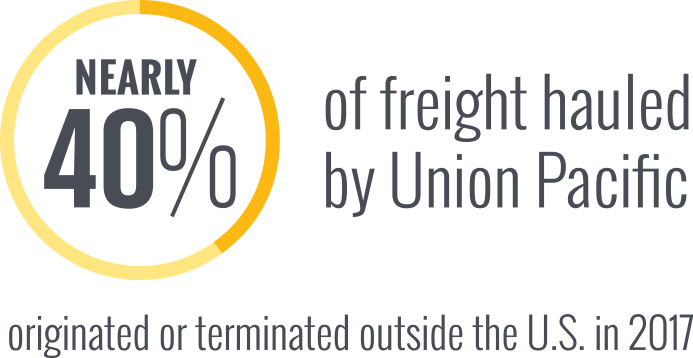
Our railroad directly serves many of the fastest growing cities in the United States and connects the country’s global supply chain at all major West Coast and Gulf Coast ports to Canada, Mexico and the country’s eastern gateways. In 2017, nearly 40 percent of our freight originated or terminated outside of the U.S.
2017 Freight Revenue
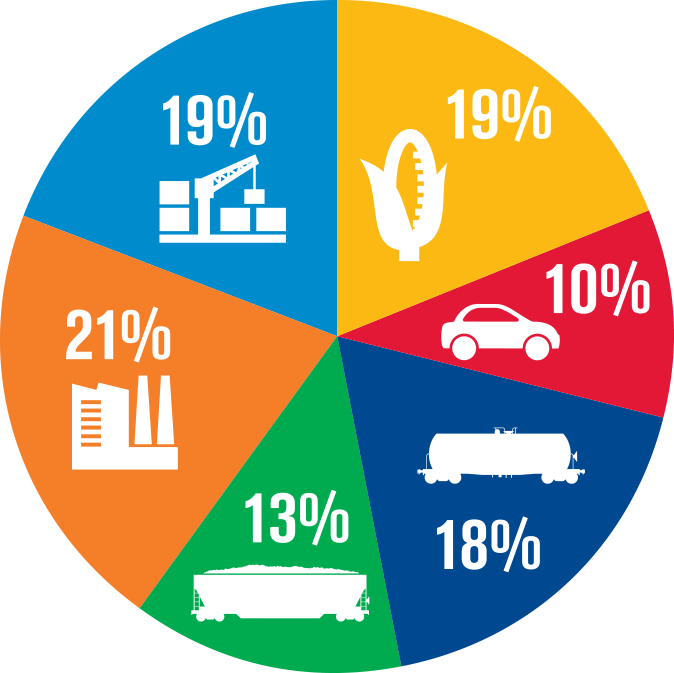
Diversified Business Products
Agricultural Products
We haul the whole grains and other agricultural goods feeding America and many other parts of the world.
Automotive
We transport automotive parts, finished vehicles and aftermarket vehicles from assembly plants and distribution centers, as well as West Coast and Gulf of Mexico ports.
Chemicals
We carry the chemicals needed to clean drinking water and fertilize crops. We also transport petrochemicals, including plastics, crude oil and soda ash.
Coal
Coal generated more than 30 percent of America’s electricity in 2017, according to the U.S. Energy Information Administration. We ship coal from mines in the Southern Powder River Basin, Utah, Colorado, southern Wyoming and southern Illinois, delivering to electric plants, as well as ports.
Industrial Products
We carry a broad range of raw materials and finished goods, including steel, pipe, frac sand, cement, military equipment, wind turbine components and lumber.
Intermodal
We transport intermodal freight containers for domestic and international shippers, moving products such as electronics, toys, furniture and clothing. One Union Pacific train takes up to 300 trucks off America’s congested highways.
Mexico Markets
We are the leading freight transportation services provider between the United States and Mexico, and the only railroad serving all six major Mexico gateways. Cross-border traffic with Mexico comprised about 11 percent of Union Pacific’s total 2017 volume.
As the needs of our customers evolve, we rise to meet them. Effective Jan. 1, 2018, Union Pacific consolidated its six major business units into four: Agricultural Products, Energy, Industrial and Premium. We refocused our customer service center and consolidated four subsidiaries into one – Loup Logistics Company – to better serve our customers. Loup combines the strengths of Union Pacific Distribution Services, Streamline, ShipCarsNow and Insight Network Logistics to provide innovative transportation logistics services that help connect shippers to rail.
Risk Oversight Approach
We operate a dynamic enterprise risk management process with continuous monitoring to identify and address potential concerns, including those arising in the ever-changing economic, political, legal and technology threat environment in which Union Pacific operates.
The Union Pacific Board of Directors oversees assessment and management of our critical enterprise risks. Management identifies and prioritizes these risks, including those disclosed in our Annual Report Form 10-K, and regularly presents to the board. T he board's Audit Committee is responsible for oversight, managing risks related to financial reporting, environmental matters and compliance, receiving reports throughout the year from the chief compliance officer and senior executives who are responsible for financial reporting, cybersecurity and environmental matters. It also oversees Union Pacific's internal audit of enterprise risks selected for review and evaluation based upon our annual assessment model, designed to evaluate the effectiveness of mitigating controls and personnel activities. Internal auditors present findings regarding the mitigating controls and processes for the enterprise risks selected for review. The committee, in turn, reports those findings to the board.
Sustainability Management Approach
Our business grows by understanding the needs of our communities and customers – and responding to those needs with dedication and commitment. Our sustainability approach reflects this. We are committed to engaging employees in our mission, transporting products safely, providing family-supporting jobs, operating ethically, protecting and strengthening the environment, and investing in America's communities.
Union Pacific's Chairman, President and CEO, and senior management oversee our corporate social responsibility strategy and report progress to the board of directors. A cross-functional management team is responsible for development and day-to-day operations while our nearly 42,000 full-time employees embrace and implement the strategy. Our corporate citizenship is important – it's a way to unify our diverse workforce around a single purpose.
Our Sustainability and Citizenship Goals
Union Pacific's Building America Report details the company's progress toward key pillars of our sustainability and citizenship strategy:
- Operating a safe, efficient and environmentally responsible rail network that delivers the best customer experience.
- Providing employees with the safest work environment.
- Constantly improving employee, customer and public safety through training, education, innovation and investment.
- Developing programs and processes making us an employer of choice.
- Investing in our network infrastructure to enhance safety, service and efficiency.
- Growing our business profitably and responsibly so we can invest in the future and positively impact employees, communities, customers and shareholders.
- Creating economic strength and improving quality of life in the 7,000 communities where we operate.
We track our performance toward these goals using the Key Performance Indicators (KPIs) shown in the table on page 7. Modeled after Global Reporting Initiative standards, our KPIs align with our stakeholder groups' priorities. Achieving success in each category directly impacts Union Pacific's business. KPIs are updated annually in this report. Financial performance and Operating Safely numbers are presented during Union Pacific's quarterly earnings calls.
Business and Industry Affiliations
Union Pacific is a member of many national industry and business organizations, including the following:
- American Frozen Foods Institute
- Intermodal Association of North America
- National Rail Labor Conference
- American Wind Energy Association
- Midwest Association of Rail Shippers
- National Safety Council
- Association of American Railroads
- National Association of Manufacturers
- Operation Lifesaver
- Business Roundtable
- National Association of Rail Shippers
- Southwest Association of Rail Shippers
- Food Shippers of America
- National Freight Transportation Association
- United States-Mexico Chamber of Commerce
- GoRail
- National Grain and Feed Association
- U.S. Chamber of Commerce
- GreenBiz Executive Network
- National Minority Supplier Development Council
- Women's Business Enterprise National Council
Key Performance Indicators
Stakeholder Engagement
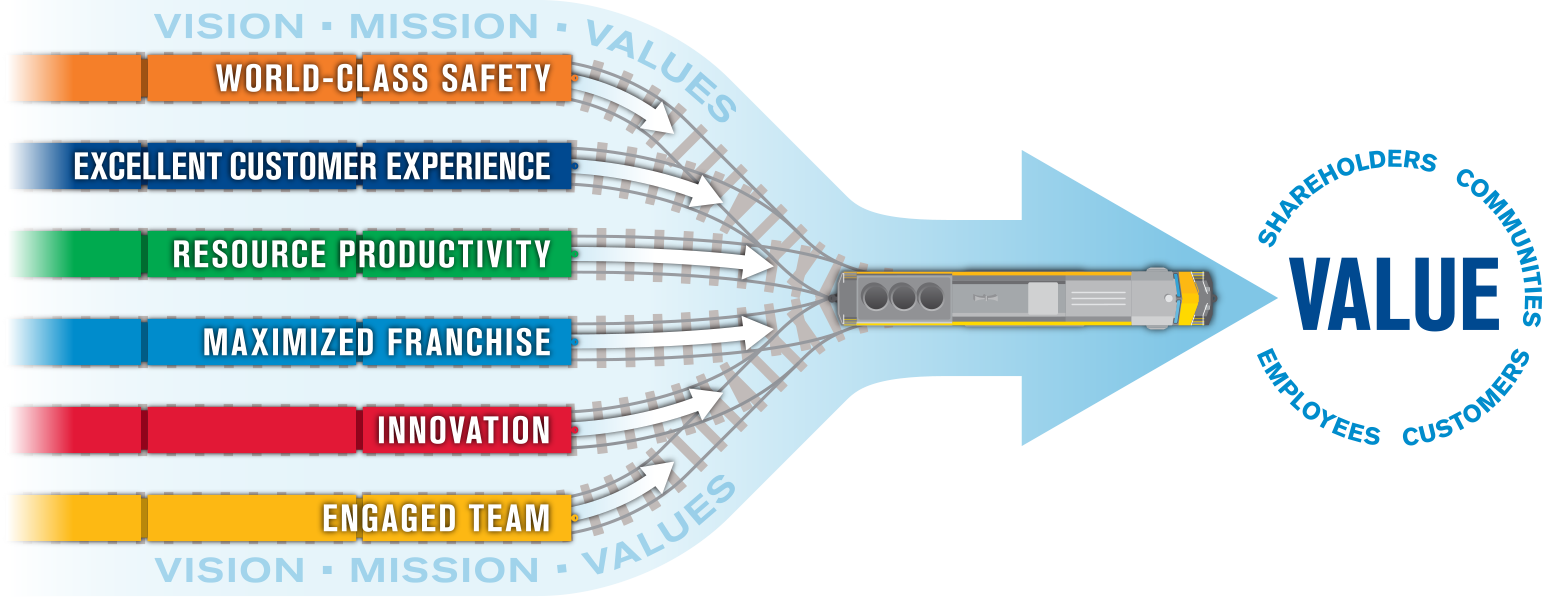
Everything Union Pacific does is built on our vision, mission and values. Focusing our efforts around our six-track Value Strategy creates long-term value for our four key stakeholders: employees, customers, communities and shareholders.
- World-class safety: An evolving model that incorporates individual accountability, data-driven processes and a relentless examination of every deviation to understand root causes, eliminating incidents and mitigating risk.
- Excellent customer service: More than the service product, we anticipate needs, keep commitments and offer solutions. The customer experience plays a critical role in our ability to grow.
- Innovation: Ever-present throughout the railroad, innovation is about not being satisfied with current results and thinking outside the box through a combination of "little I" approaches – a new way of thinking about routine tasks – and "big I" concepts leading to substantial change.
- Resource productivity: Getting the most out of what we have. This means turning cars faster, making assets last longer and having fuel take us further.
- Maximized franchise: This is more than our physical footprint on a map. It includes our employees and their expertise, our service products, market reach and proprietary technology.
- Engaged team: When employees are empowered and respected, they feel connected to the company. This inspires passion and dedication, while leveraging diverse talents and creating the best ideas.
Union Pacific's approach to sustainability requires engaging with our four key stakeholder groups to understand their evolving needs, ultimately creating competitive advantages for customers, job stability for employees, solid returns for our shareholders and economic strength in our communities.
Key Audiences
Employees
Union Pacific employees work 24/7 in more than 7,000 communities across our 23-state service area. We engage employees through the following channels:
- Communication from our CEO in many forms, such as online and in-person town halls with question-and-answer sessions; CEO videos that cover key issues including safety and employee engagement; and a CEO blog that highlights observations from field visits and topics impacting the company.
- Information Television network.
- Customized local newsletters.
- Senior management town halls with question-and-answer sessions.
- Employee clubs, resource groups, networks, focus groups and surveys.
- Labor Relations Connection, an online portal for union employees.
- Ethics bulletins and our values line, allowing employees to anonymously report concerns 24/7.
Customers
Union Pacific has great relationships with its customers. At the heart of those relationships is great communication. Communication enables us to develop solutions meeting their changing needs and supporting growth. We engage customers through the following channels:
- Regular face-to-face, teleconference and virtual meetings.
- Our customer website.
- Social media.
- Customer bulletins and emails.
- Estimated time-of-arrival notifications.
- Customer surveys and forums, evaluations and suggestions.
- Our Customer Care and Support team.
Communities
Union Pacific's business positively impacts local communities through economic development, family-supporting jobs and reduced road congestion. We seek to support communities and manage potential negative impacts through the following channels:
- Local public affairs representatives who regularly work with elected officials, economic development alliances, civic groups and other community organizations.
- Our national 24/7 emergency hotline. In addition to emergency response, operators work with callers reporting issues, such as blocked crossings.
- Event sponsorships and employee volunteering.
- Community Ties Giving Program.
- Our Crossing Accident Reduction and Education Safety (UP CARES) program.
- Free safety training for emergency responders.
- Inside Track – our website dedicated to sharing news, photos and video about Union Pacific, our employees and the communities where we live and work.
- Social media platforms including Facebook, LinkedIn, Twitter, Instagram, YouTube and Glassdoor.
Shareholders
Clear communication with shareholders is important to Union Pacific. We engage them through the following channels:
- Annual reports, proxy statements and SEC filings.
- Corporate Governance of Union Pacific and its board of directors.
- Our Investor Relations site featuring upcoming events, public filings, industry reports, shareholder resources and answers to frequently asked questions.
- Annual Building America Report and Fact Book.
- Shareholder meetings with management and investor conferences.
- Quarterly earnings, reports and conference calls.
Regulatory Officials
Union Pacific works closely with regulatory officials to align our business with the country's infrastructure requirements, and shape a responsible and sustainable operating environment through the following channels:
- Transparent compliance reports, voluntary agreements and in-person meetings.
- Ongoing dialogue via staff in Washington D.C. and across our network.
- Participation in the Association of American Railroads (AAR) and U.S. Environmental Protection Agency's (EPA's) SmartWay Transport Partnership.
- Employee and corporate regulatory and legislative advocacy.
- The Union Pacific Environmental Management Program.
- Collaboration with U.S. Customs and Border Protection (CBP) and other government agencies.
Suppliers
Suppliers are an important part of Union Pacific's business – they help us serve our customers with excellence and provide quality materials. We manage suppliers through our Supplier Code of Conduct and Quality program, engaging them through the following channels:
- Electronic commerce capabilities.
- Supplier performance tracking system.
- Supplier diversity program.
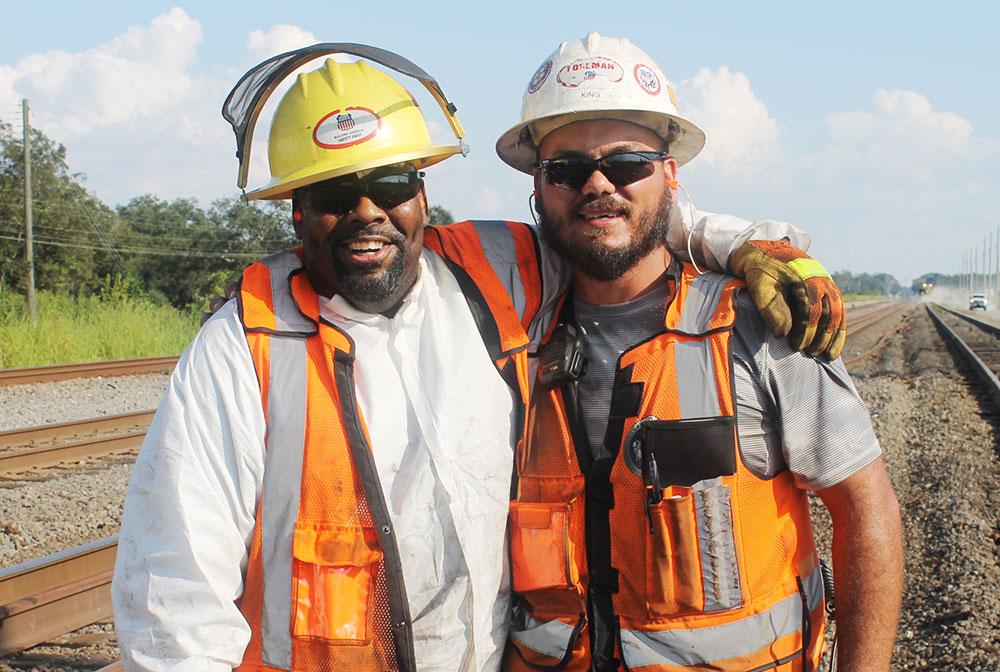
Rail Gang 9102 Spike Operator Kenneth Jacobs and Assistant Foreman Damien King value peer support.
Key Awards and Recognition
Union Pacific is proud of the external recognition we've received from our efforts to operate safely, strengthen communities, engage employees and preserve the environment. We were recognized with the following awards:
- No. 1 in Fortune's Most Admired among trucking, transportation and logistics companies.
- No. 1 in Brand Finance's 2017 listing of the 500 most valuable U.S.brands.
- Named in Forbes' Best Employer list.
- Ranked No. 46 on Barron's World's Most Respected Companies List.
- Among top 10 on Monster's Best Companies for Veterans in 2017.
- Earned a spot on the 2017 Military Friendly Employers List by MilitaryFriendly.com.
- Received the Extraordinary Employer Support Award from the Employer Support of the Guard and Reserve (ESGR) Nebraska Chapter, recognizing our sustained support to the Reserve Components of the United States Armed Forces.
- Inbound Logistics recognized Union Pacific as one of the 75 Green Supply Chain Partners for the fourth year.
- Ranked No. 61 among all U.S. businesses in Newsweek's 2017 Green Ranking.
- Recognized as a top performer for the fifth time in the Soy Transportation Coalition Railroad Report Card.
- EPA's SmartWay Award presented to Union Pacific Distribution Services, now known as Loup Logistics, for the second consecutive year.
Looking Ahead
2018 Goals
Economic Impact
- $3.3 billion investment in our infrastructure.
- Maximize our franchise with completion of Industrial Development projects.
Operating Safely
- Continued strides toward an incident-free environment.
- Continued community engagement through UP CARES and social media to decrease crossing incidents.
Strengthening Communities
- Increase overall community giving to more than $20 million.
- Launch key partnerships with Safe Kids Worldwide, National Park Foundation and LISC.
Engaging Employees
- Complete Employee Engagement Survey and use results to further enhance company culture.
- Drive greater participation in Innovation Station campaigns.
Preserving the Environment
- Test and grow switching fleet with low power and emission locomotives.
- Eliminate unnecessary water use and identify ways to conserve.
Feedback
For questions on this report or to provide feedback, contact Union Pacific via email at sustainability@up.com.
Our Commitment
Since our founding more than 150 years ago, Union Pacific has driven economic growth in America. Our vision, mission and values are focused on completing tasks better tomorrow than we do today, enabling Union Pacific to remain critical to the American economy in the centuries to come. We will continue to strive to be the best in the business in our safety initiatives, on our tracks, in our communities, across our workforce and for our environment. The 2017 Building America Report shares our initiatives and progress, thus far. We are proud of our accomplishments and our work to improve operations. In the years ahead, we will continue to invest in our employees, communities and infrastructure because they shape our growth and success.
Additional Resources
For ongoing updates on our citizenship and sustainability efforts, visit www.up.com.
- Media – Up-to-date information about Union Pacific.
- Environment – Sustainability commitments and progress.
- Employees – Programs and services available to our workforce.
- Customers – Product offerings and business groups.
- Investors – Annual report, proxy statements and other SEC filings.
- Communities – News, photos and video about Union Pacific, our employees and the communities where we operate.
- Careers – Career opportunities and benefits to joining Union Pacific’s workforce.
Cautionary Information
Our Building America Report provides additional explanatory information regarding Union Pacific that may not be available, included or directly derived from information in the company’s Annual Report. This report includes statements and information regarding future expectations or results of the company that are not historical facts. These statements and information are, or will be forward looking as defined by federal securities laws. Forward-looking statements and information can be identified by use of forward-looking terminology (and derivations thereof), such as “believes,” “expects,” “may,” “should,” “will,” “would,” “intends,” “plans,” “estimates,” “anticipates,” “projects” and other words or phrases of similar intent. Forward-looking statements and information generally include the following: the company’s expectations or forecasts with respect to general economic conditions in the United States and the world; the company’s financial and operational performance; increases of the company’s earnings; demand for the company’s rail service; improving customer service; enhancing profitability; volume and revenue growth; efficiency improvements and increasing returns; and improving asset utilization. Statements also include the effectiveness or growth of new and newer services; management of network volumes; increasing shareholder value; total amount of capital investments; completion and effectiveness of capacity expansion and other capital investments, and other investments in infrastructure improvements; returns on capital investments; improvements regarding safety of our operations and equipment; improving efficiencies in fuel consumption; preserving the environment and communities where the company operates; and effectiveness of plans, programs and initiatives to reduce costs and other efficiency improvements. Forwardlooking statements and information should not be read as a guarantee of future performance or results and will not necessarily be accurate indications of the times that, or by which, such performance or results will be achieved. Forward-looking statements and information are subject to risks and uncertainties that could cause actual performance or results to differ materially from those expressed in the statements. Forward-looking statements and information reflect the good faith consideration by management of currently available information and may be based on underlying assumptions believed to be reasonable under the circumstances. However, such information and assumptions (and, therefore, such forward-looking statements and information) are or may be subject to variables or unknown or unforeseeable events or circumstances over which management has little or no influence or control.
The risk factors in Item 1A of the company’s Annual Report Form 10-K, filed Feb. 9, 2018, could affect our future results and could cause those results or other outcomes to differ materially from those expressed or implied in the forward-looking statements and information. This report should be read in consideration of these risk factors. To the extent circumstances require or the company deems it otherwise necessary, the company will update or amend these risk factors in subsequent Annual Reports, periodic reports on Form 10-Q or current reports on Form 8-K. Forward-looking statements speak only as of the date the statement was made. We assume no obligation to update forward-looking information to reflect actual results, changes in assumptions or changes in other factors affecting forward-looking information. If we do update one or more forward-looking statements, no inference should be drawn that we will make additional updates with respect thereto or with respect to other forward-looking statements.