Union Pacific

2015 Building America
Report

A report to communities on our social, environmental and economic sustainability progress.

Union Pacific's mission of service defines us and drives our commitment to safely transport products across the country, provide good jobs, operate ethically and invest in our country by investing in our communities.

Union Pacific's mission of service defines us and drives our commitment to safely transport products across the country, provide good jobs, operate ethically and invest in our country by investing in our communities.

This report details our progress in key areas that together support social, economic and environmental sustainability pillars: operating safely, strengthening communities, engaging employees and working to preserve the environment. We also summarize our 2015 financial performance.

We used the Global Reporting Initiative's G4 Guidelines to inform reporting on our most material social responsibility issues. This publication focuses on initiatives and accomplishments from the 2015 calendar year and includes 2015 data, unless otherwise noted.

Download the Report

VISION

Building America

MISSION

The Men and Women of Union Pacific are Dedicated to Serve

VALUES

Passion for Performance
High Ethical Standards
Work as a Team

Letter to Stakeholders

As a company that has operated for more than a century and a half, sustainability is built into the fabric of Union Pacific's performance. We recognize our responsibilities as a corporate citizen and are proud to move the goods Americans use every day in a safe, efficient and environmentally responsible manner.

Sustainable business practices are fundamental to Union Pacific's success. They are inherent to our evolved strategy that challenges us to rise above daily tasks and take a 10,000-foot view of where we need to go and what it takes to get there. We call it, "Creating Value the UP Way," and it requires aligning our six value tracks: world-class safety, excellent customer experience, innovation, resource productivity, maximized franchise and an engaged team. We introduced these interrelated tracks in late 2015 as our foundation for success that provides competitive advantages for customers, job stability for employees, returns for shareholders and economic strength in our communities.

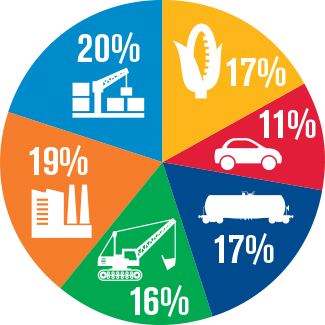
Overall economic conditions, uncertainty in the energy markets and the strength of the U.S. dollar contributed to a challenging 2015. Volume declines in coal, international intermodal, frac sand, metals, crude oil and grain shipments more than offset volume growth in domestic intermodal, finished vehicles, automotive parts, industrial chemicals and plastics shipments. We will continue responding to market uncertainties with resiliency to support customers and pursue new business development opportunities.

While we adapt to changing markets, Union Pacific's commitment to Building America and investing in a strong, healthy railroad remains constant. Last year's record $4.3 billion capital program strengthened U.S. transportation infrastructure through private investment, not taxpayer dollars. Investing in a safe, efficient railroad helps communities attract new business, clears trucks off congested highways and reduces wear and tear on publicly funded roads.

Our Building America Report provides a macro view of how we performed in key areas. Each section in this report provides insight on our progress, challenges and commitments.

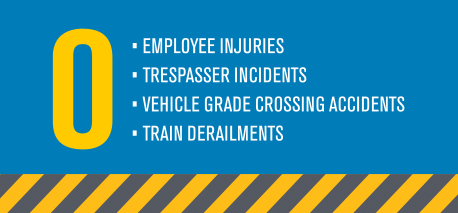
  • Operating Safely illustrates how Union Pacific became the safest Class I railroad in the United States, based on our 2015 employee reportable injury rate. This section also discusses our Crossing Assessment Program, which is focused on enhancing public safety at railroad crossings.
  • Strengthening Communities highlights how we improve the quality of life in the communities where our employees live and work, as well as our specific efforts to recruit military veterans, women and millennials.
  • Engaging Employees demonstrates how we believe our company's success rests on the shoulders of our people, and how we support our diverse workforce by providing tools that foster employee growth.
  • Preserving the Environment underscores Union Pacific's commitment to reducing our environmental footprint, while creating a sustainable economy that benefits our entire country.

We are proud of the work we do and understand there is always more to learn and improve upon. That is why we value continuous conversation with our stakeholders and view this report as a piece of that broader discussion. I invite you to use this report to learn more about Union Pacific and what we hope to achieve.

Lance Fritz
Chairman, President and CEO

View More
Building America Report 2015 - Lance Fritz - Chairman, President and CEO

Key Performance Indicators

  • FINANCIAL 2013 2014 2015
    Reported net income $4.4 billion $5.2 billion $4.8 billion
    Operating revenue $22.0 billion $24.0 billion $21.8 billion
    OPERATING SAFELY 2013 2014 2015
    Rail crossing accidents (per million train miles) 2.22 2.34 2.28
    Reportable injury rate*
    (per 200,000 employee-hours)
    1.10 0.98 0.87
    Public outreach About 9,000 events reached more than 616,300 people About 13,580 events, reached more than 629,500 people More than 15,000 events reached more than 600,000 people
  • STRENGTHENING COMMUNITIES 2013 2014 2015
    Capital program
    (private funds, no taxpayer dollars)
    $3.6 billion $4.1 billion $4.3 billion
    Spend with minority- and women-owned businesses $484 million $509 million $423 million
  • ENGAGING EMPLOYEES 2013 2014 2015
    Percent of employees unionized 86% 85% 85%
    Workforce diversity 6% Female, 94% Male
    1% Asian
    11% Black
    74% Caucasian
    12% Hispanic
    2% Native American
    6% Female, 94% Male
    2% Asian
    11% Black
    73% Caucasian
    12% Hispanic
    2% Native American
    6% Female, 94% Male
    2% Asian
    11% Black
    73% Caucasian
    12% Hispanic
    2% Native American
    U.S. Population 2014 census data (permits reporting of more than one race): 5% Asian, 13% Black, 77% Caucasian, 17% Hispanic, 1% Native American
  • PRESERVING THE ENVIRONMENT 2013 2014 2015
    Energy usage 45.7 million megawatt hours 48.4 million megawatt hours 44.5 million megawatt hours
    Water usage withdrawals** 1.90 billion gallons 1.78 billion gallons 1.54 billion gallons
    GHG emissions
    Intensity per million gross ton miles 12.6 metric tons 12.6 metric tons 12.7 metric tons
    Locomotive fossil fuel emissions (scope 1) 11,153,933 metric tons 11,850,514 metric tons 10,834,984 metric tons
    Fossil fuel emissions (scopes 1 and 2) 11,953,871 metric tons 12,666,733 metric tons 11,683,549 metric tons
    Employee travel (scope 3) 18,210 metric tons 19,977 metric tons 19,803 metric tons
    Purchases from biomass sources 94,519 metric tons 87,744 metric tons 129,600 metric tons
  • PRESERVING THE ENVIRONMENT 2013 2014 2015
    Waste**
    Total waste generated 1.15 million tons 1.05 million tons 1.04 million tons
    Tonnage diverted from landfills 79% 81% 68%
    E-waste Approximately 410,000 pounds recycled or reused Approximately 270,000 pounds recycled or reused Approximately 270,000 pounds recycled or reused
    *Restated 2013 to reflect previous employee-hour miscalculations
    **Restated based on revised methodologies

Social, Environmental and Economic Sustainability Goals

Union Pacific's vision of Building America aligns with social, environmental and economic sustainability pillars. Our goals include:

  • Operating a safe, efficient and environmentally responsible rail network that delivers the best customer service.
  • Providing employees with the safest work environment.
  • Constantly improving employee, customer and public safety through training, education, innovation and investment.
  • Developing employee programs and processes that make us an employer of choice.
  • Investing in our network infrastructure to enhance safety, service and efficiency.
  • Growing our business profitably and responsibly so we can invest in the future and make a positive impact on our employees, communities, customers and shareholders.
  • Creating economic strength and improving the quality of life in the 7,000 communities where we operate.
Building America Report 2015 - Main - Zeroing In

Zeroing in on Safety

No injury is acceptable. That's why our ultimate goal is achieving annual safety records toward zero:

Fuel Consumption Rate and GHG Emissions Goal

We adjusted our goal to reduce locomotive fuel consumption based on the well-documented reduction in heavier weight commodity shipments. Our revised goal is to reduce Union Pacific's fuel consumption rate by 0.5 percent each year from 2015 to 2017. Measured on a gross ton basis, this will result in a greenhouse gas emissions reduction rate of 0.5 annually. We will continue to evaluate our fuel consumption goal as we adjust to changing market conditions.

More information about the steps we are taking to improve fuel efficiency is located in the Preserving the Environment section.

Risk Oversight of the Company

Our enterprise risk management process is dynamic and continually monitored so we can identify and address with agility any potential risks that arise in the ever-changing economic, political and legal environment in which Union Pacific operates.

Management identifies and prioritizes enterprise risks and regularly presents them to our board of directors for review and consideration. Senior executives responsible for implementing mitigation strategies for each of the company's enterprise risks, along with the chief compliance officer, provide reports directly to the board during the year. We also report risk factors in our Annual Report on Form 10-K.

The board Audit Committee oversees the company's internal audit of enterprise risks. Internal auditors present to the Audit Committee their findings regarding mitigating controls and processes for enterprise risks. The Audit Committee, in turn, reports those findings to the entire board.

Stakeholder Outreach

Union Pacific interacts with many different groups in the course of our operations, and we take into account their range of perspectives in setting social, environmental and economic sustainability priorities.

Key stakeholders:
  • Communities
  • Customers
  • Employees
  • Shareholders
Additional audiences:
  • Advocacy groups
  • Policy makers and regulators
  • Suppliers

Communication Channels

Communities

  • Employee volunteers
  • UP CARES (Crossing Accident Reduction and Education Safety program)
  • Employee and corporate giving
  • Nationwide 24-hour emergency hotline: 888-877-7267
  • Safety training for fire and law enforcement personnel
  • Union Pacific and communities joint emergency response committees
  • Employee recruiting
  • State-specific public affairs contacts and outreach
  • Public-private partnerships
  • Facebook, LinkedIn, Twitter, YouTube and other social media channels
  • Community Ties online news
  • Event sponsorships
  • News releases
  • RSS feed

Customers

  • Union Pacific account representatives
  • National Customer Service Center
  • Customer satisfaction surveys
  • Web portal
  • Marketing
  • Electronic commerce capabilities
  • Industry-specific customer education seminars
  • Customer news and service updates
  • Events and trade shows
  • Partnerships and memberships
  • Supply chain impact evaluation for customers
  • Pinnacle Awards for chemicals customers
  • Innovative customer partnerships, including TRANSCAER
  • Carbon Emission Estimator
  • News releases
  • RSS feed

Employees and Retirees

  • UPOnline daily news updates
  • Employee website
  • Employee ethics hotline
  • Business ethics bulletins
  • Inside Track employee magazine
  • Union Pacific Information Television
  • Senior management online and in-person town halls
  • Craft-specific and regional employee newsletters
  • Labor Relations Connection, an online portal for union employees
  • Retirees and families website
  • Employee Resource Groups
  • Safety policies, training and certification programs
  • Education assistance and management training
  • Friend to Friend employee network
  • Performance management
  • Surveys and focus groups
  • Leadership meetings
  • Recognition programs
  • Employee clubs
  • Peer Support
  • CEO letters
  • Family days
  • Company calendar

Shareholders

  • Annual reports and proxy statements
  • Investor conferences
  • Shareholder meetings with management
  • Earnings conference calls
  • SEC filings
  • Quarterly earnings reports
  • Email alerts
  • Website FAQ
  • Annual Fact Book

Regulatory Officials

  • Union Pacific Environmental Management Program
  • Ongoing dialogue via our Washington, D.C.-based staff
  • Participation in the Association of American Railroads
  • Commitment to meet voluntary agreements with the California Air Resources Board and other states
  • Collaboration with U.S. Customs and Border Protection
  • Employee and corporate regulatory and legislative advocacy
  • Voluntary participation in initiatives, including the U.S. Environmental Protection Agency’s SmartWay Transport Partnership
  • News releases
  • RSS feed

Suppliers

  • Competitive bid process
  • Electronic commerce capabilities
  • Supplier diversity program
  • Supplier Code of Conduct
  • Supplier performance tracking system
  • Supplier quality program
  • Website FAQ
Building America Report 2015 - Main - Stakeholder Outreach

About Union Pacific

Fast Facts

44,500Employees

32,100Route Miles

8,500Locomotives

23States

7,300Communities served

Building America Report 2015 - Main - About UP Fast Facts map

Union Pacific Railroad is the principal operating company of Union Pacific Corporation (NYSE: UNP). One of America's most recognized companies, Union Pacific Railroad connects 23 states in the western two-thirds of the country by rail, providing a critical link in the global supply chain. From 2006 to 2015, Union Pacific invested approximately $33 billion in its network and operations to support America's transportation infrastructure.

The railroad's diversified business mix includes Agricultural Products, Automotive, Chemicals, Coal, Industrial Products and Intermodal. Union Pacific serves many of the fastest-growing U.S. population centers, operates from all major West Coast and Gulf Coast ports to eastern gateways, connects with Canada's rail systems and is the only railroad serving all six major Mexico gateways. Union Pacific provides value to its roughly 10,000 customers by delivering products in a safe, reliable, fuel-efficient and environmentally responsible manner.

Union Pacific is a member of many national industry and business organizations, including:

  • American Frozen Foods Institute
  • American Wind Energy Association
  • Association of American Railroads
  • Food Shippers of America
  • Global Environmental Management Initiative
  • GoRail
  • GreenBiz Executive Network
  • National Association of Manufacturers
  • National Business Group on Health
  • National Freight Transportation Association
  • National Grain and Feed Association
  • National Minority Supplier Development Council
  • National Safety Council
  • Operation Lifesaver
  • United States-Mexico Chamber of Commerce
  • U.S. Chamber of Commerce
  • Women’s Business Enterprise National Council
View More
Building America Report 2015 - Main - Diversified Business Product Pie Chart

Diversified Business Products

Union Pacific moves the goods American families and businesses use every day. Just about everything in homes, offices, manufacturing facilities, construction sites and stores moves by train at some point.

Agricultural Products | Revenue: $3.6 billion

We haul the products that feed the nation and many parts of the world, efficiently delivering whole grains and other agricultural goods.

Automotive | Revenue: $2.2 billion

Union Pacific provides transportation and logistics for automotive parts, finished vehicles and aftermarket vehicles. We directly serve five vehicle assembly plants, distribute imported vehicles from the West Coast and Gulf of Mexico, and operate or access distribution centers for all major automotive manufacturers.

Chemicals | Revenue: $3.5 billion

Union Pacific carries the chemicals used to clean drinking water, produce plastics and fertilize our crops. We also transport petrochemicals, crude oil extracted from U.S. shale locations and soda ash.

Coal | Revenue: $3.2 billion

Coal generated about 30 percent of America’s electricity in 2015. Union Pacific ships coal from mines in the Southern Powder River Basin, Utah, Colorado, southern Wyoming and southern Illinois. Our geographic reach and connections allow us to deliver coal to electric plants across the nation, West Coast and Gulf Coast ports, and facilities on the Mississippi and Ohio Rivers and Great Lakes.

Industrial Products | Revenue: $3.8 billion

Union Pacific ships a variety of raw materials and finished goods, including steel, pipe, frac sand, cement, military equipment, wind turbine components and lumber.

Intermodal | Revenue: $4.1 billion

Intermodal involves transporting freight in an intermodal container or vehicle using multiple modes of transportation (rail, ship and truck). This method reduces cargo handling and improves security and efficiency. One Union Pacific intermodal train can take several hundred trucks off America’s congested highways. We deliver a wide range of multimodal solutions for domestic and international freight shippers moving products such as electronics, toys, furniture, clothing and auto parts.

Mexico Markets

Union Pacific is the leading freight transportation services provider to and from the United States-Mexico border and is the only railroad to serve all six major Mexico gateways. Revenue from our six business units includes $2.2 billion from Mexico in 2015.

View More

Governance and Ethics

Our commitment to ethics begins with our board of directors and is maintained through every level of our organization. We work diligently to uphold the highest standards, and to provide quality service and value to our customers, investors and employees.

We believe that how we do things is as important as what we do. All Union Pacific employees are trained on our Policy on Ethics and Business Conduct, "The How Matters.” The policy conveys the basic principles of ethical business conduct expected of all employees. As a foundation, the principles are grounded in compliance with applicable laws and rules, and observe the highest ethical standards, including honesty, fairness, integrity and respect.

See Corporate Governance for other relevant policies and procedures, as well as information on our board of directors.

ETHICS EDUCATION

Union Pacific's Policy on Ethics and Business Conduct, "The How Matters," was updated in 2015 and introduced to employees during our second annual Ethics Awareness Week.

The policy has a new, easy-to-read format that provides real-world examples of ethical obligations. Its rollout included computer-based training with question-and- answer segments to help employees check their understanding of topics, and an online article series that addressed workplace concerns and the importance of ethics to Union Pacific's reputation.

The How Matters is at the heart of how our dedicated employees carry out our mission and values. Our continuous conversation about ethical behavior and how we treat each other ensures The How Matters is part of everything we do at Union Pacific.

Building America Report 2015 - Main - Governance Ethics

Key Awards and Recognition

Looking Ahead

FEEDBACK

For questions on this report or to provide feedback, contact Union Pacific via email at sustainability@up.com.

OUR COMMITMENT

Since our founding more than 150 years ago, Union Pacific has driven economic growth in America. Our mission, strategy and workforce all are focused on completing tasks better tomorrow than we do today, enabling Union Pacific to remain critical to the American economy in the centuries to come. We will continue to strive to be the best in the business in our safety initiatives, on our tracks, in our communities, across our workforce and for our environment. The 2015 Union Pacific Building America Report shares our initiatives and progress thus far. We are proud of our accomplishments and our work to improve our operations. In the years ahead, we will continue to invest in our employees, communities and infrastructure because they shape our growth and success.

ADDITIONAL RESOURCES

For ongoing updates on our citizenship and sustainability efforts, visit the following.

  • Media. Up-to-date information about Union Pacific
  • Environment. Sustainability commitments and progress
  • Employees. Programs and services available to the members of our workforce
  • Customers. Product offerings and business groups
  • Investors. Annual report, proxy statements and other SEC filings
  • Communities. News, photos and video about Union Pacific, our employees and the communities where we operate

CAUTIONARY INFORMATION

Our 2015 Building America Report provides additional explanatory information regarding Union Pacific that may not be available, included or directly derived from information in the company's Annual Report. This report includes statements and information regarding future expectations or results of the company that are not historical facts. These statements and information are, or will be, forward looking as defined by the federal securities laws. Forward-looking statements and information can be identified by use of forward-looking terminology (and derivations thereof), such as "believes," "expects," "may," "should," "will," "would," "intends," "plans," "estimates," "anticipates," "projects" and other words or phrases of similar intent. Forward-looking statements and information generally include the following: the company's expectations or forecasts with respect to general economic conditions in the United States and the world; the company's financial and operational performance; increases of the company's earnings; demand for the company's rail service; improving customer service; enhancing profitability; volume and revenue growth; efficiency improvements and increasing returns; and improving asset utilization. Statements also include the effectiveness or growth of new and newer services; management of network volumes; increasing shareholder value; total amount of capital investments; completion and effectiveness of capacity expansion and other capital investments, and other investments in infrastructure improvements; returns on capital investments; improvements regarding safety of our operations and equipment; improving efficiencies in fuel consumption; preserving the environment and communities where the company operates; and effectiveness of plans, programs and initiatives to reduce costs and other efficiency improvements. Forward-looking statements and information should not be read as a guarantee of future performance or results and will not necessarily be accurate indications of the times that, or by which, such performance or results will be achieved. Forward-looking statements and information are subject to risks and uncertainties that could cause actual performance or results to differ materially from those expressed in the statements. Forward-looking statements and information reflect the good faith consideration by management of currently available information and may be based on underlying assumptions believed to be reasonable under the circumstances. However, such information and assumptions (and, therefore, such forward-looking statements and information) are or may be subject to variables or unknown or unforeseeable events or circumstances over which management has little or no influence or control.

The risk factors in Item 1A of the company's Annual Report on Form 10-K, filed Feb. 5, 2016, could affect our future results and could cause those results or other outcomes to differ materially from those expressed or implied in the forward-looking statements and information. This report should be read in consideration of these risk factors. To the extent circumstances require or the company deems it otherwise necessary, the company will update or amend these risk factors in subsequent Annual Reports, periodic reports on Form 10-Q or current reports on Form 8-K. Forward-looking statements speak only as of the date the statement was made. We assume no obligation to update forward-looking information to reflect actual results, changes in assumptions or changes in other factors affecting forward-looking information. If we do update one or more forward-looking statements, no inference should be drawn that we will make additional updates with respect thereto or with respect to other forward-looking statements.