Governance
Disclose the Organization's Governance around Climate-Related Risks and Opportunities
a) Describe the board's oversight of climate-related risks and opportunities.
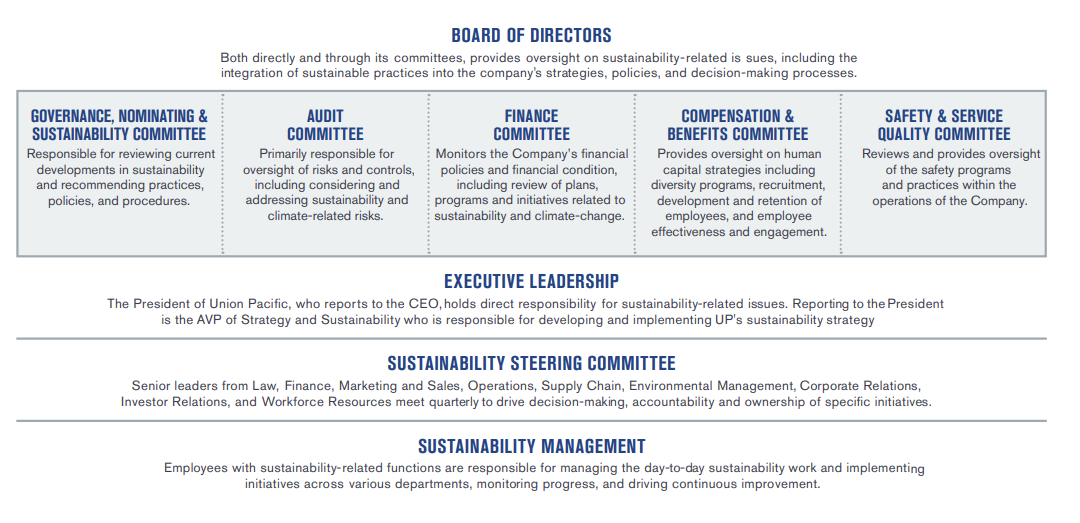
Union Pacific’s climate actions are integrated into the company’s governance structure. The Board of Directors provides oversight on sustainability-related issues, including the integration of sustainable practices into the company's strategies, policies, and decision-making. The Corporate Governance, Nominating and Sustainability Committee is responsible for reviewing current developments in sustainability and recommends adoption of new, or modifications to existing practices, policies, and procedures. The Audit Committee is primarily responsible for oversight of risks and controls, including considering and addressing sustainability and climate-related risks. The Audit Committee also reviews reporting of metrics and key performance indicators regarding the Company’s safety and climate initiatives. Other Board Committees have the sustainability oversight responsibilities as set forth in their respective Committee Charters.
b) Describe management's role in assessing and managing climate-related risks and opportunities.
Union Pacific manages climate-related risks and opportunities across all levels of the organization. The President of Union Pacific, who reports to the CEO, holds direct responsibility for sustainability-related issues, including climate. Reporting to the President is the AVP of Strategy and Sustainability who is responsible for developing and implementing UP's climate strategy. Senior leaders from Law, Finance, Marketing and Sales, Operations, Supply Chain, Environmental Management, Corporate Relations, Investor Relations, and Workforce Resources make up the Sustainability Steering Committee and meet quarterly to drive decision-making, accountability and ownership of specific initiatives. Employees with sustainability-related functions are responsible for managing the day-to-day sustainability work and implementing initiatives across various departments, monitoring progress, and driving continuous improvement.
Strategy
Disclose the Actual and Potential Impacts of Climate-Related Risks and Opportunities on the Organization's Business, Strategy and Financial Planning
a) Describe the climate-related risks and opportunities the organization has identified over the short, medium and long-term.
Union Pacific defines the short-term horizon as 0-3 years, the medium-term horizon as 3-10 years, and the long-term horizon as 10-30 years. With respect to climate-related risks, we are most likely to be affected in the short term by acute physical risks. As a railroad with a vast network, we are exposed to severe weather conditions and other natural phenomena, including earthquakes, hurricanes, forest fires, floods, mudslides or landslides, extreme temperatures, avalanches, and significant precipitation. Track outages and other interruptions caused by these conditions can adversely affect our rail network, potentially negatively affecting revenue, costs, and liabilities, despite efforts we undertake to plan for these events.
Chronic physical risks associated with shifting climate patterns and increased temperatures present longer-term risks.
Additionally, we are subject to transition risks involving policy and legal risks and market risks. Regulatory policies restricting our taxing emissions could significantly increase the cost of our operations and that of certain customers. We are also managing shifts in demand for fossil fuels and other commodities that are being affected by the energy transition that is underway. The medium- and long-term effects of transition risks are less certain, but we are working to better understand these impacts through our planning processes.
Climate change, including the impact of global warming and transition risks involving policy, legal risks, and market risks, could have a material adverse effect on our results of operations, financial condition, and liquidity over both a long-term and near-term basis:
- Restrictions, caps, taxes, or other controls on emissions of GHGs, including diesel exhaust, could significantly increase our operating costs. Restrictions on emissions could also affect our customers that (a) use commodities that we carry to produce energy, (b) use significant amounts of energy in producing or delivering the commodities we carry, or (c) manufacture or produce goods that consume significant amounts of energy or burn fossil fuels, including chemical producers, farmers and food producers, and automakers and other manufacturers.
- Significant cost increases, government regulation, or changes of consumer preferences for goods or services relating to alternative sources of energy, emissions reductions, and GHG emissions could materially affect the markets for the commodities we carry and demand for our services, which in turn could have a material adverse effect on our results of operations, financial condition, and liquidity.
- Government incentives encouraging the use of alternative sources of energy also could affect certain of our customers and the markets for certain of the commodities we carry in an unpredictable manner that could alter our traffic patterns.
b) Describe the impact of climate-related risks and opportunities on the organization's businesses, strategy and financial planning.
Impacts on Transportation Product: Climate change presents challenges and risks that extend beyond our network due to the interconnectedness of North American rail networks and the interoperability of equipment among railroads. Severe weather events affecting one carrier's network can disrupt interchange partners, highlighting the need for coordinated resilience strategies.
Impacts on Financial Planning and Partnerships: As a capital-intensive industry with long-lived assets, railroading requires a thoughtful approach to climate change. Collaborative efforts across the rail industry and its value chain are essential for developing effective solutions. Our annual financial planning processes assess potential revenues and growth projections, considering climate-related risks and opportunities. We allocate capital expenditures towards climate-related projects, such as LED lighting infrastructure replacement and the development of hybrid- and zero-emissions locomotives. Additionally, specific budgets are allocated to support operational and asset plans that mitigate potential disruptions from extreme weather events, promoting network reliability and efficiency.
Impacts on Technology and R&D Initiatives: Union Pacific participates in AAR's Decarbonization Working Group and Locomotive Committee to identify emerging technologies that support rail industry decarbonization. We are exploring partnerships with other rail carriers and equipment and energy suppliers to develop new locomotive technologies and fuel solutions that advance our decarbonization efforts.
Impacts on Public Policy Approach: Union Pacific engages with government agencies and non-governmental organizations to identify strategies that align with our climate targets. This engagement helps shape policies that support industry-wide decarbonization and resiliency.
c) Describe the potential impact of different scenarios, including at 2°C scenario, on the organization's business, strategy and financial planning.
In 2022, we conducted an extensive climate scenario analysis to better understand the risks to and opportunities for our operations, infrastructure and supply chains from specific climate scenarios. In 2023, our CSA risks were mapped against our enterprise risk management framework to help us manage climate-related risks and opportunities. The analysis is being used to evaluate and develop strategies to allow us to respond to both high- and low-carbon scenarios. Our analysis integrated several factors to represent plausible future pathways based on credible science, developed by experts at the International Energy Agency (IEA) and other reputable organizations. The results of this scenario analysis are intended to inform our understanding of our business’ climate-related risk and opportunities and support planning and investment decisions.
We analyzed perspectives from internal leaders, suppliers, customers, peer literature review and expert assessment to gather insights regarding the climate-related risks and opportunities they identified in the rail industry. We have targeted nine priority climate-related driving forces that have impacted and/or were deemed to have potential further impacts on Union Pacific:
Physical
- Acute climate change: Increasing frequencies of short-duration extreme weather events, such as hurricanes, wildfires, storms and floods. These events may affect our infrastructure and operations, potentially impacting our service levels, increasing costs and requiring investments to improve our infrastructure’s resiliency.
- Chronic climate change: Long-term changes in weather patterns, such as secular shifts in annual temperature and precipitation levels. These events represent both a risk to our infrastructure and our work patterns, and potential opportunities as consumers and our customers shift to new climate realities.
Market
- Decarbonization of power generation: While the pace and scope of decarbonization of electrical power generation may vary across our markets, it is highly likely that the power generation sector will continue to replace fossil fuel power generation with renewable fuel sources over the long term, impacting company revenues. Additionally, renewable energy products, feedstocks and infrastructure can be a positive revenue opportunity.
- Low-carbon transition: The economy-wide carbon emission reductions and transition to low-carbon businesses represent both a risk and opportunity to our business.
- Stakeholder sustainability interest: Sustainability-related expectations by our stakeholders (shareholders, customers, communities and employees) have grown significantly, with concomitant demands for climate-related performance commitments, transparent disclosure, and climate-benefiting investment.
Policy
- Environmental policy and regulation: These are generally expected to become more stringent over time. State-by-state adoption of GHG emissions-reduction standards or prescriptive regulations regarding low-carbon technology or fuel may subject our company to a patchwork of applicable regulations. Public low-carbon infrastructure spending can directly or indirectly benefit Union Pacific.
Technology
- Electrification of transportation: Transition from combustion engines to electric motors powered by renewable fuels in the North American transportation sector is continuing at differing speeds across modal types, with uncertainties arising as to cost, availability, procurement and performance.
- Low-carbon fuels: Reduction of carbon emissions through biofuels enables many power generation technologies to transition to a renewable power source. Uncertainty arises from the availability of biofuel feedstocks, policy and regulation, and social and economic challenges. Transport of renewable diesel and associated feedstocks is a potential revenue growth opportunity.
- Energy and infrastructure: Fuel and electricity prices are challenging to predict and can fluctuate greatly in the near and long term. There is uncertainty around the amount of low-carbon fuel and electricity required for a net-zero future and the ability of the electrical infrastructure to meet this growing demand.
We worked with outside experts to describe two climate scenarios relevant to Union Pacific based on physical climate and transition trends and data identified in reputable public sources such as the IEA and IPCC. We caution that each of these scenarios is hypothetical and as we continue to refine our approach, technology develops and the world changes, these scenarios may change accordingly.
- Scenario #1: High-Carbon World: This scenario is characterized by an economy that largely fails to decarbonize – emissions reductions from efficiency gains and low-carbon energy are offset by an increasing population and gross domestic product (GDP). Emissions in the U.S. flatline from 2023 onwards, but global emissions double by 2050, exacerbating physical climate risks such as hurricanes and heat waves. While carbon pricing is muted, lower investment in climate-related innovation and technology means mitigation costs are higher than in low-carbon scenarios. Reference Scenarios: RCP 8.5, IEA STEPS and EIA Reference Case.
- Scenario #2: Low-Carbon World: This scenario is characterized by an economy that reaches net zero by 2050. Decarbonization is led by the power generation and transportation sectors – each of which decarbonize rapidly, creating widespread opportunities for companies providing low-carbon services. Still, global emissions drive up U.S. mean air temperatures 1.4°C above pre-industrial levels by 2050, increasing physical climate risks such as hurricanes, heat waves and agriculture impacts, though less than in the High-Carbon World. Climate policy is also a significant driver and carbon pricing reaches notable highs. Reference Scenarios: IEA NZE, EIA Low Renewables Cost, EIA High Oil Price, IPCC RCP 2.6, EnerFuture EnerGreen.
We identified and assessed the potential impacts of four priority risk/opportunity drivers on Union Pacific’s business under both the High-Carbon and Low-Carbon scenarios, using a combination of climate and business data.
- Carbon Pricing Exposure: Union Pacific may face substantially increased operational costs in the short- to mid-term due to increasing carbon prices. This can be mitigated by reducing company emissions. Carbon pricing may also represent an opportunity for our company as potential customers seeking lower transportation costs shift transportation modes to rail.
- Electricity Generation Mix: A sharp decline in the demand for coal transportation is anticipated. This decline may be partially mitigated by demand for transportation of wind and other low-emissions electricity generation infrastructure. Component shipments will likely increase, creating new revenue opportunities.
- Agriculture Impacts: Decreasing corn yields in the Midwest can pose a challenge as there have been greater exports from this region lately due to higher-demand markets and dry conditions in the Southwest. Overall increasing wheat yields in the U.S. can present a potential significant opportunity for global export markets.
- Acute Climate Risk: In a high-carbon world, greater incidence of operational and maintenance challenges from acute weather – extreme precipitation, flooding, heat waves, and wildfire – could require changes in the level or type of investments for infrastructure and operational resiliency.
Union Pacific is identifying potential strategic responses to mitigate the risks and capitalize on opportunities identified in the climate scenario analysis. Further development of these strategic responses for both the high- and low-carbon scenarios should help us prioritize climate-related impacts against other business risks and opportunities, and designate business and climate trend indicators as signposts that can indicate the emergence of strategic decision points for action by the company. We are taking an iterative approach to climate scenario analysis to be integrated into our business planning processes.
Risk Management
Disclose how the Organization Identifies, Assesses, and Manages Climate-Related Risks
a) Describe the organization's processes for identifying and assessing climate-related risks.
Union Pacific’s enterprise risk management process is dynamic and regularly monitored so the company can timely identify and address any potential risks that arise in the ever-changing economic, political, legal and technology threat environment in which it operates, as well as address business continuity and long-term operational resiliency.
Our Board of Directors oversees the assessment and management of critical enterprise risks. Management identifies and prioritizes enterprise risks and reviews them with the Board at least once a year to answer questions and obtain input related to mitigation strategies and categories of risk.
The Board delegates to the Audit Committee primary responsibility for oversight of risks related to financial and operational controls as well as sustainability and climate-related risks.
b) Describe the organization's processes for managing climate-related risks.
Union Pacific assesses the likelihood and magnitude of climate-related impacts to determine appropriate response strategies, whether to mitigate, transfer, accept, or avoid identified risks, and to capitalize on opportunities. This monitoring and evaluation process involves the Enterprise Risk Management (ERM) Committee, which regularly presents prioritized risks, including climate-related risks, to the Board for review and consideration. The ERM Committee meets monthly to monitor enterprise risk indicators and coordinate risk assessment and mitigation initiatives. High-probability and high-cost risks are prioritized by the ERM Committee.
Senior executives responsible for implementing mitigation strategies, along with the Chief Accounting, Risk, and Compliance Officer, report directly to the Audit Committee and/or the Board throughout the year. The process includes an assessment of cost, materiality and probability, with higher or more severe assessments along any of those three dimensions receiving higher prioritization and attention. In each case, the criteria for materiality and priorities are dictated first and foremost by an analysis of impacts to health and safety. Evaluation of impacts to customer service, and the environment also dictate materiality and priority. These criteria are not mutually exclusive and can overlap.
c) Describe how processes for identifying, assessing and managing climate-related risks are integrated into the organization's overall risk management.
“Climate-related risk” is identified as an enterprise risk in our Annual Report Form 10K. In 2022, we completed our first climate scenario analysis (CSA), a thorough evaluation of the climate-related risks and opportunities we may encounter under various potential climate scenarios. In 2023, our CSA risks were mapped against our enterprise risk management framework to help us manage climate-related risks and opportunities.
Union Pacific collects and assesses information regarding climate-related risks and opportunities as the operational performance (short-term 0-3 years), infrastructure health level (medium-term 3-10 years), and long-term business strategy level (10-30 years) at least once a year. This risk and opportunity process incorporates bottom-up input from multiple departments, including Finance, Strategic Planning, Sustainability, Operations, Engineering, Law, Marketing & Sales, Corporate Relations, Finance, and the Fuel & Environmental Management Team.
Risks and opportunities identified as high probability and/or high-cost events are addressed as priority items within our overall risk/opportunity management process by the Enterprise Risk Management (ERM) Committee, which manages our multi-disciplinary company-wide risk management process. The ERM Committee meets monthly to monitor enterprise risk indicators, and coordinate risk assessment and mitigation initiatives.
Metrics and Targets
Disclose the Metrics and Targets Used to Assess and Manage Relevant Climate-Related Risks and Opportunities
a) Disclose the metrics used by the organization to assess climate-related risks and opportunities in line with its strategy and risk management process.
- Union Pacific employs a range of metrics to assess climate-related risks and opportunities, aligning these evaluations with our broader strategy and risk management processes. Continuous improvement in fuel efficiency, network efficiency, and the use of biofuels are key metrics that directly impact our greenhouse gas emissions.
- Our Marketing & Sales team plays a crucial role in identifying climate-related commercial risks and opportunities. They collaborate closely with our Sustainability Team when engaging in customer conversations, ensuring that their approach to climate-related issues is comprehensive and informed by the latest sustainability insights. This collaboration helps us better understand and respond to the evolving expectations and needs of our customers.
- The Finance team at Union Pacific has implemented mechanisms to capture and track climate-related capital expenditures. Additionally, our capital project review process rigorously evaluates investments, challenging them when clean energy alternatives are available. This process helps align our capital allocation with our long-term sustainability goals.
We will continue to evolve sustainability-related key performance indicators in our executive compensation scorecard.
b) Disclose Scope 1, Scope 2 and, if appropriate, Scope 3 greenhouse gas (GHG) emissions and the related risks.
We disclose our Scope 1, Scope 2 and Scope 3 emissions in our Sustainability Metrics data page.
c) Describe the targets used by the organization to manage climate-related risks and opportunities and performance against targets.
In our 2021 Climate Action Plan, we committed to an approved science-based target to reduce our Scope 1 and 2 emissions on an absolute basis by 26% from our 2018 baseline by 2030, and to reduce our Scope 3 to locomotive well-to-wheel emissions by 26% from a 2018 baseline over the same period.
In 2023, we completed a revalidation and in early 2024 the Science Based Targets initiative approved our new 2030 target, committing us to reduce absolute Scope 1 and 2 GHG emissions by 50.4% by 2030 from a 2018 base year. We are also committed to reducing Scope 3 absolute emissions from our purchased goods and services, capital goods and fuel- and energy-related activities 50.4% by 2030 from a 2018 base year.